
The morning headlines speak frequently of new solar powered plants for generating electricity and the declining unit costs for these. My purpose here is to show that solar power generating performance depends upon the amount of energy received from the sun and how this varies across the US. Some comments are particularly relevant for New Jersey.
Global Horizontal Irradiation
Scientists define the term “global horizontal irradiation” (GHI) as the “total amount of shortwave radiation received from above by a surface horizontal to the ground.” It may be measured in units of kilowatt-hours per square meter (KWH/M2).
Solar energy is most intense when the sun is directly overhead at noon in summer, and it falls off as the sun retreats to the west in the afternoon, and to the south in winter. The position on the globe is also a factor, with more intense energy at the equator and less as one moves north or south.
Bottom line: GHI is affected by the time of day, by the season of the year, and by the location on the earth’s surface. It is also affected by material in the atmosphere that blocks some of the sun’s energy from reaching the surface, and this can vary daily with clouds and over longer periods with volcanic eruptions.
GHI Map
Scientists have measured GHI over time and throughout the world, and have made maps that show total average daily GHI by location. A map for the US is below. (See Note 1)
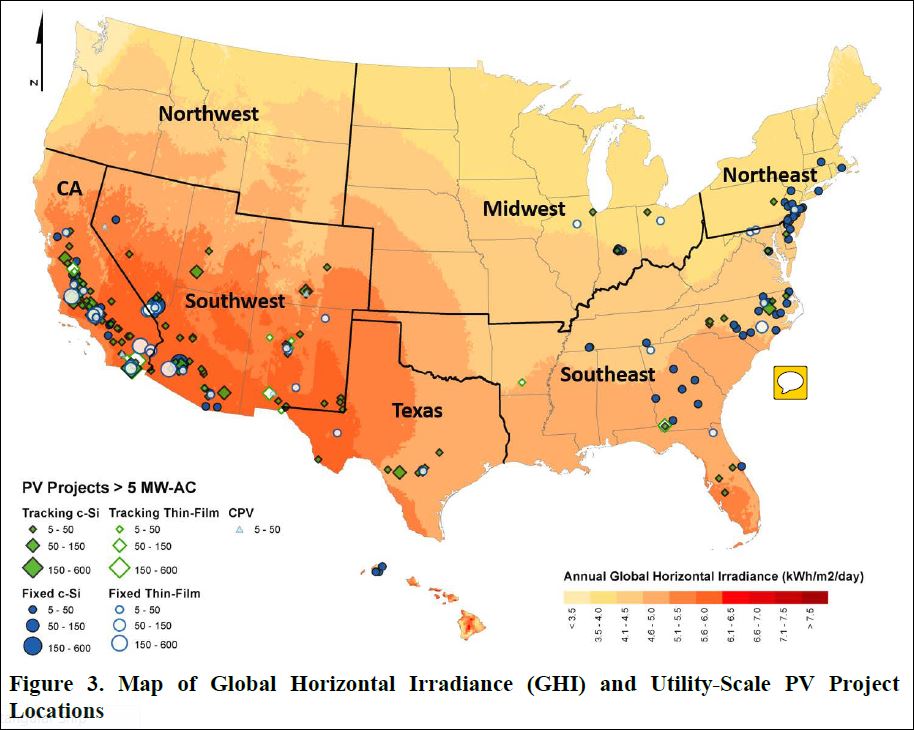
The map shows six GHI zones, ranging from the coolest in northwest Washington state (Zone 1, light yellow) to the hottest near the southwest border (Zone 6, dark orange). Each zone is defined by a range of GHI values that are shown in the legend. Note that these are averages for a 24-hour day and over a 365-day year.
NJ lies half in Zone 2 and half in Zone 3, for an average GHI of about 4.0 KWH/M2 per day for the state. The southwest border is in Zone 6 with a median GHI of 5.8, 45% greater than NJ.
Electric Power Generation
The federal Energy Information Administration (EIA) publishes reams of data. Useful for this analysis are a table of electric energy produced and another table with so-called “nameplate” generating capacity, both organized by state, energy source, and year.
Data and a chart for solar energy by state in 2015 and GHI are in a spreadsheet. To see this click spreadsheet. Descriptions follow for the data in the columns.
Col A: Codename for a state.
Col B: The total power generated by all solar plants in a state in 2015. This is the actual energy output and is measured in megawatt hours (MWH).
Col C: Solar nameplate capacity for a state. Nameplate capacity is the power that a plant is designed to produce when everything is working right. This is the theoretical power output and is measured in MW. A quantity in this column is the total of all nameplate capacities for the state.
Col D: An estimate of GHI for a state from the GHI map.
Col E: The theoretical energy output for a state is the theoretical power in Col C times 24 hours per day and 365 days per year. The ratio of the actual energy output in Col B to the theoretical energy output is the “generation factor” or GEN FAC. It is posted in Col E, and is a measure of overall plant performance.
Many things affect GEN FAC. All production machines and facilities have to be shut down for routine maintenance from time to time. Most have breakdowns and emergency shutdowns, though these may be rare. Gas fired power plants may be scheduled to run just at peak demand periods or as backup, and this reduces their GEN FAC. Solar plants don’t run at night, and wind turbines don’t turn when there is no wind.
Nuclear had the highest GEN FAC (0.88) of any energy source in the country in 2015. Other values were coal (0.51), natural gas (0.30), wind (0.30), and solar (0.21).
GEN FAC for Solar Generation
Solar energy is the focus here. The chart below shows the generation factor as a function of GHI for twelve states that generated 100,000 or more MWH in 2015. This chart and the associated data are in the spreadsheet.
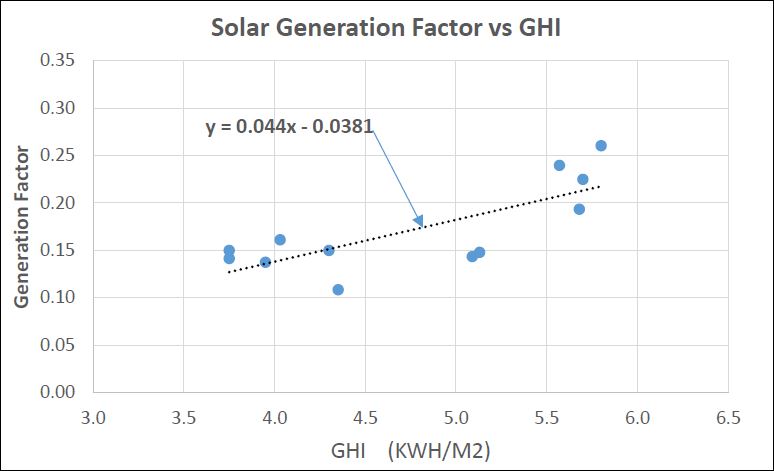
This chart is a scatter plot with a well-defined trend line. It shows that GEN FAC increases by 0.044 (4.4 percentage points) for each unit rise in GHI, where GHI is measured in KWH/M2.
This has implications for the costs of solar generated electricity. When using the same technology, its cost in NJ, where GHI is 0.16 (fourth dot in chart from the left), may be 50% greater than that in CA, where GHI is 0.24 (fourth dot from the right). Higher costs for land and labor may drive the NJ cost differential higher.
Bill Allen 01-29-17
Note 1: The GHI map is from a report from the Lawrence Berkeley National Laboratory by Bollinger and Seel and entitled “Utility-Scale Solar 2015.”