
Following is update of analysis first posted on 10-17-11 to include data for quarter ending this past September.
For many years I have read that the size of the financial sector has been growing relative to the economy as a whole. But I was unprepared for what I saw when I looked at the actual numbers.
The Burea of Economic Analysis in the Department of Commerce publishes reams of economic data. One set of tables labeled 6.16 contains annual data for pretax corporate profits by sector going back to 1929. There is quarterly data for recent years.
The tables start with a simple division of the domestic economy into two sectors: financial and non-financial. A note says that the former “consists of finance and insurance and bank and other holding companies.”
I have summarized this data for the decades after WW2 in Chart 1 below.
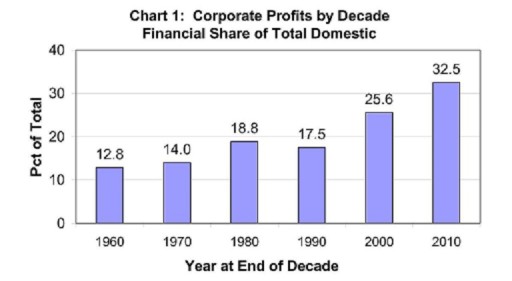
In the decade ending in 1960 the financial sector accounted for 12.8% of all domestic corporate profits. Five decades later this had grown by two and a half times to 32.5% of corporate profits. During the decade just past one profit dollar out of three went to the financial sector.
This growing financial share of the profit pie is remarkable. Those in the Occupy Wall Street demonstrations may not know the precise numbers, but I expect they feel in their bones that the financial share of corporate profits is too large.
Corporate profits peaked in 2006 and then turned down. Chart 2 shows profits for the finanancial and non-financial sectors, annualized by quarter since 2006.
The financial sector profit hit bottom and turned negative in 2008Q4 [2008 Quarter 4]. This was the “meltdown”. Profit recovered rapidly and has leveled off at near 2006 levels.
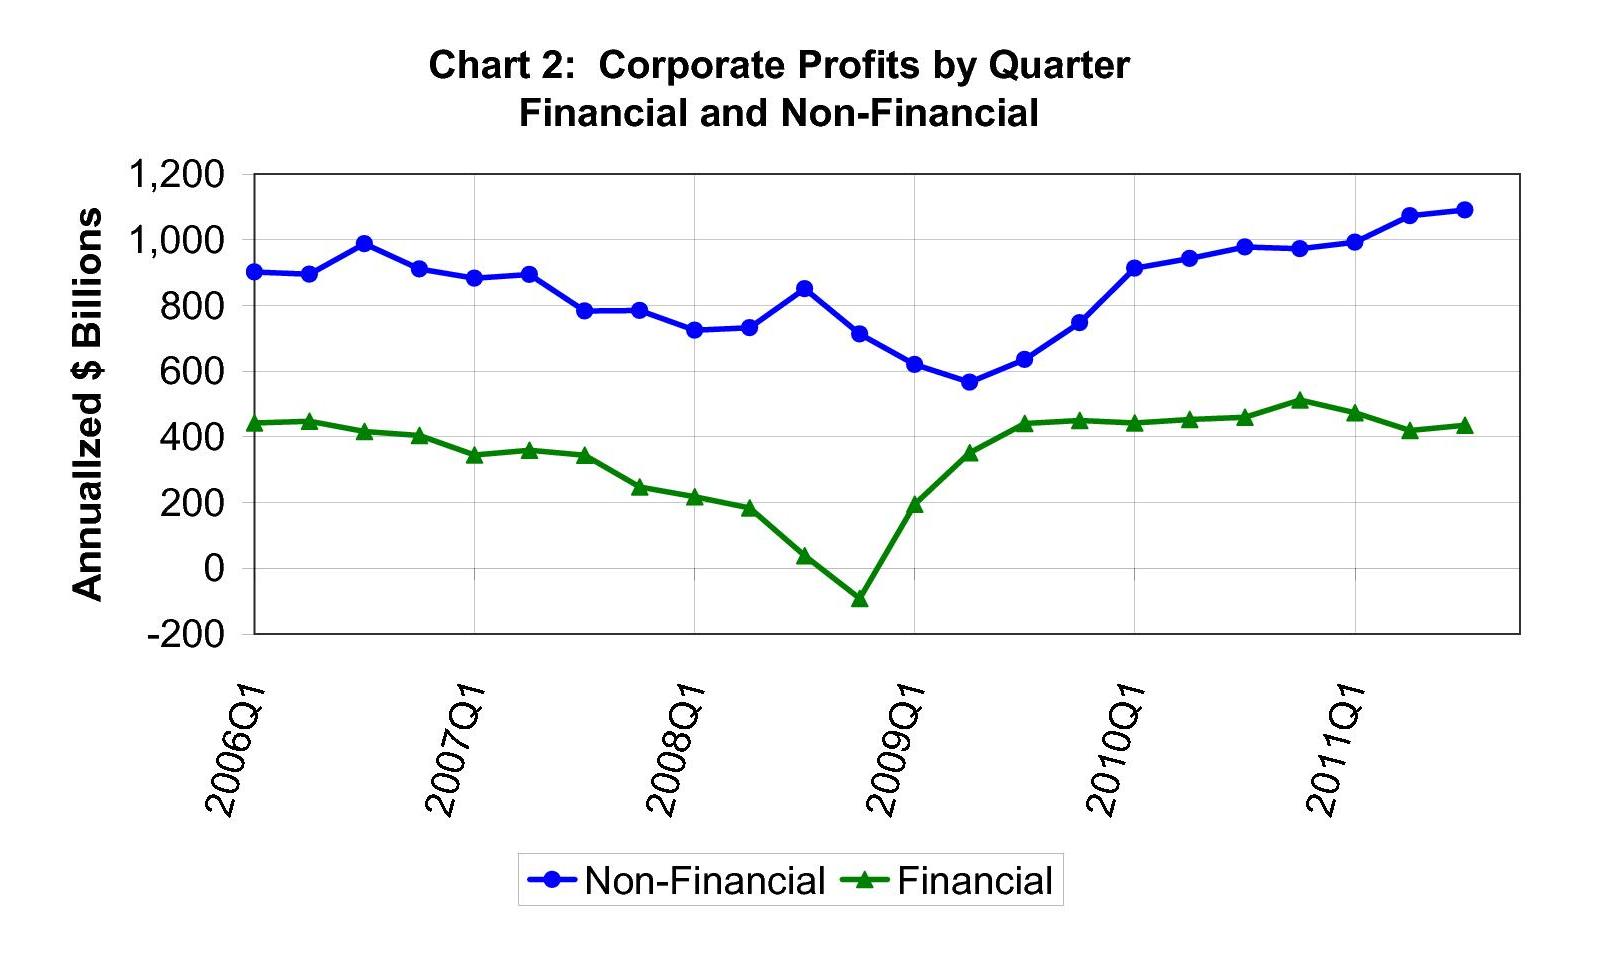
The non-financial sector profit bottomed out in 2009Q2 and recovered less rapidly. It reached 2006 levels in 2010 and continues to rise in 2011.
Chart 3 shows the profit share for the financial sector for the same quarters. It peaked in 2009, reflecting the earlier recovery relative to the non-financial sector. 2011 shows a lower level than the average for the decade ending 2010.
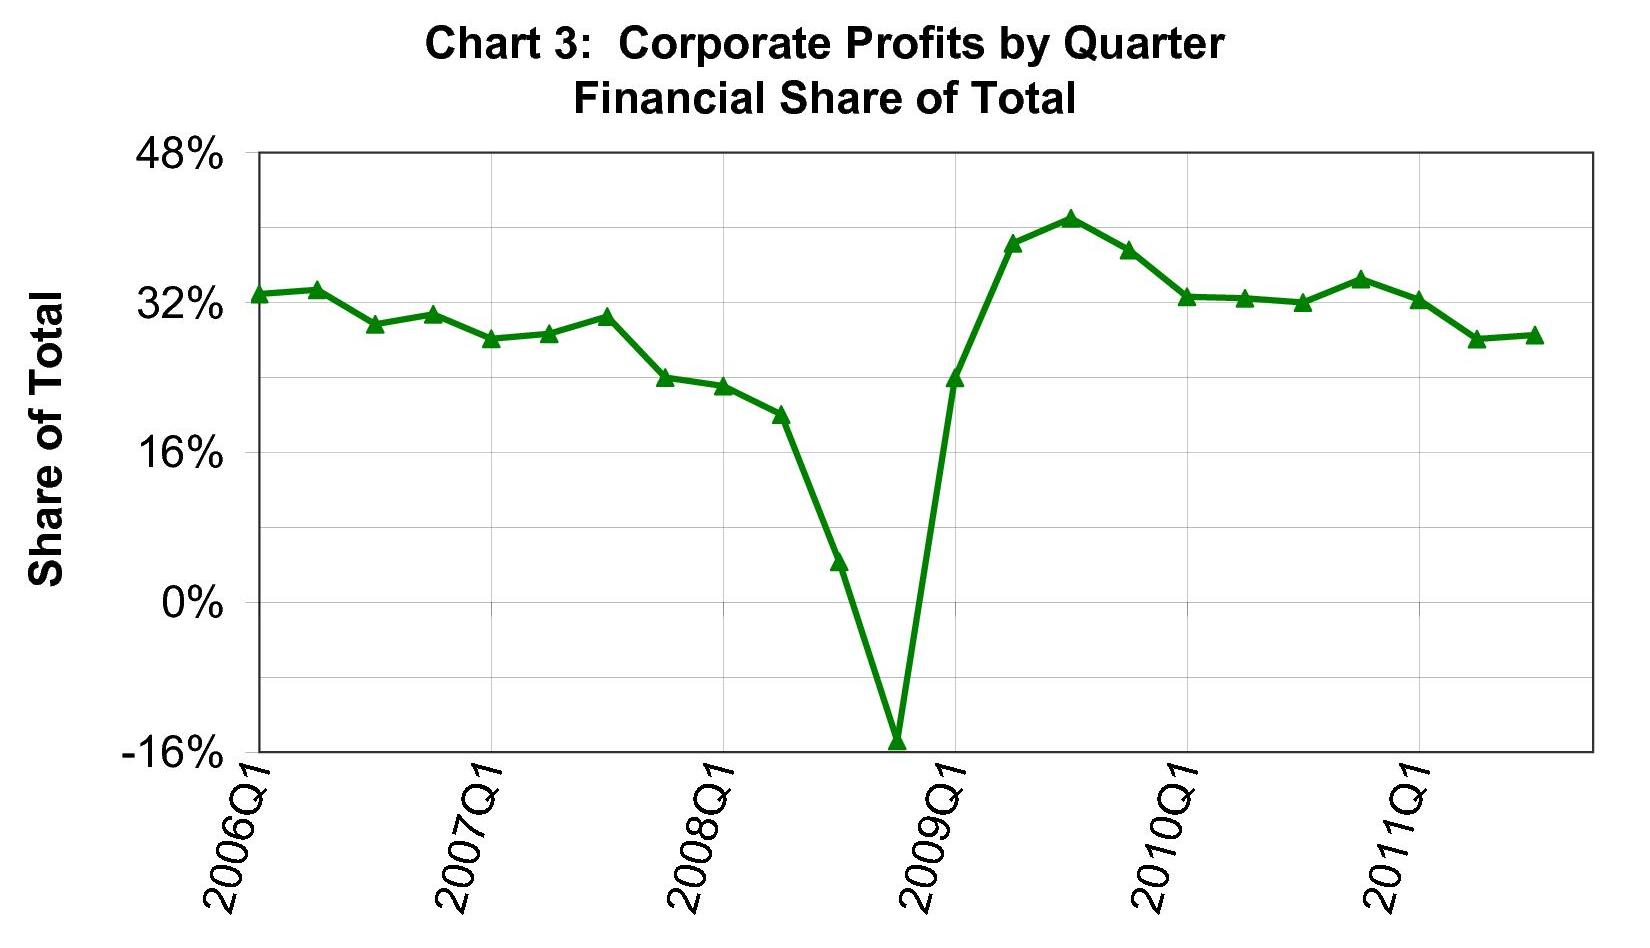
These charts show profit shares of the finanical sector marching steadily upwards during the decades after WW2. Growth of the financial share slowed in 2010 and turned negative in mid 2011. But two quarters don’t make a trend.
Wrapup: The financial sector captured a larger share of profits during five of the last six decades. Its current share is nearly one third of all domestic corporate profits.
Questions for discussion:
(1) Should taxes be raised on financial profits, or fees be imposed on some financial activites, like short term trades?
(2) Should some financial activities be prohibited, like trading in exotic derivatives that almost no one understands?
Bill Allen, 11-29-11