
I’m kind of a numbers nut and also a history buff. When confronted with a question like the one above my preference is to look at the historic data first. Often this is enough.
In his excellent new book Back to Work Bill Clinton mixes in a lot of interesting data with his economic and political insights. One table shows total jobs in the country at the end of the January’s, that end each presidential term, back to 1953.
With this data it’s possible to compute the jobs that were created during each 4-year presidential term. I have plotted these results in Chart 1 below, and colored coded Democratic administrations with blue and Republican ones with red.
 |
The blue columns are generally taller than the red ones, demonstrating that more jobs were created in Democratic administrations. A computation of the average job growth during the continuous years of one party’s control makes this more clear. This data is plotted in Chart 2.
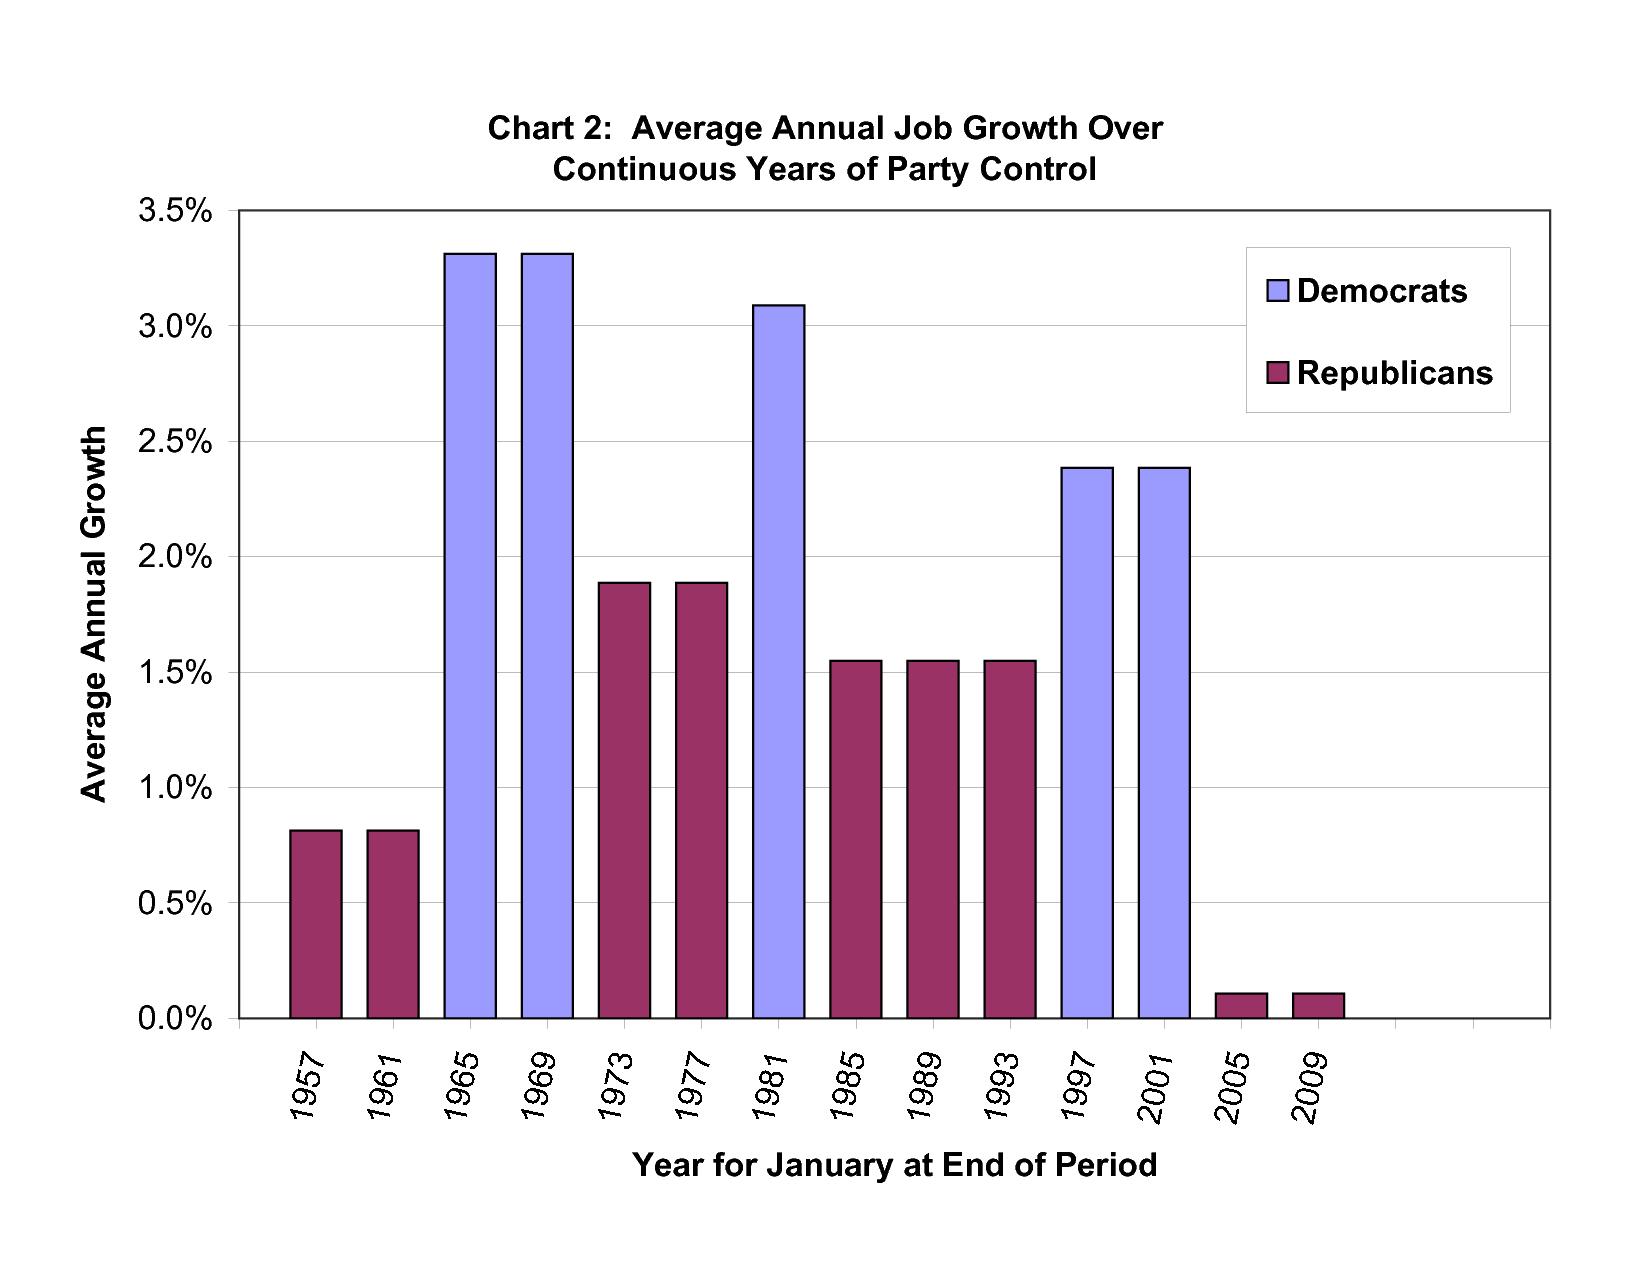 |
The job growth during each of the three Democratic administrations was greater than the highest of the four Republican administrations. Most dramatic is the comparison of Bill Clinton’s eight years with George W Bush’s eight years: 2.4% average annual job growth vs a puny 0.1% annual growth.
When you hear someone argue that we should return to the Bush policies of low taxes and lax regulation in order to produce jobs, you may conclude that he [or she] is woefully ignorant of the historic record. Or he thinks you are.
Bill Allen, 11-15-11