Donald J. Trump is a Russian agent

Letter below was submitted to Bernardsville News on 07-21-18.  It was published on line on 07-24-18 and in the print edition on 07-26-18.

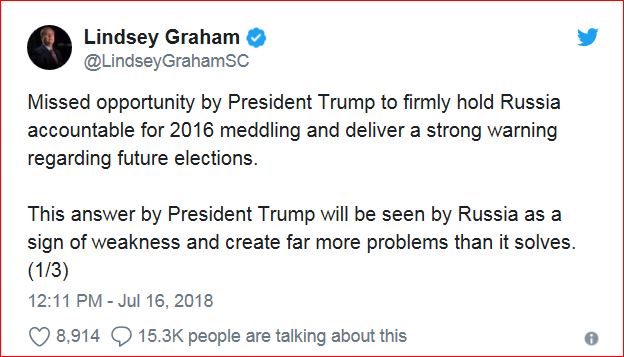
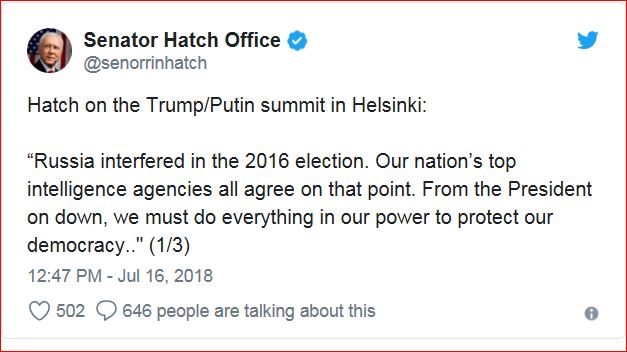
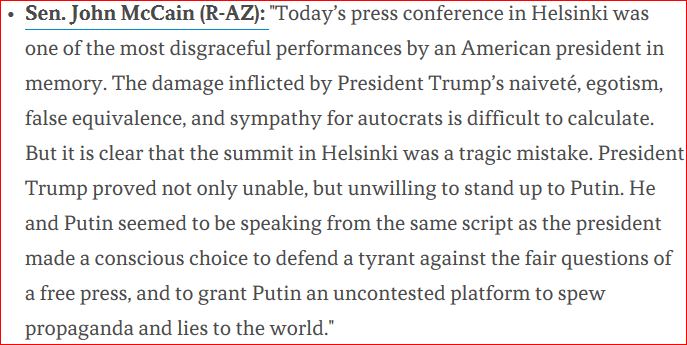
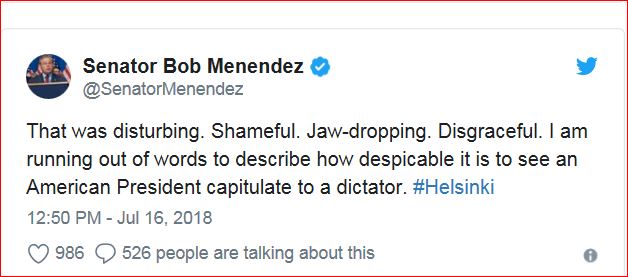
Comments following the press conference by well-known people are below the letter.

EDITOR:

“Agent:  a person who acts on behalf of another person or group.”

This dictionary definition describes the president of the United States.

  • Donald J. Trump is a Russian agent.

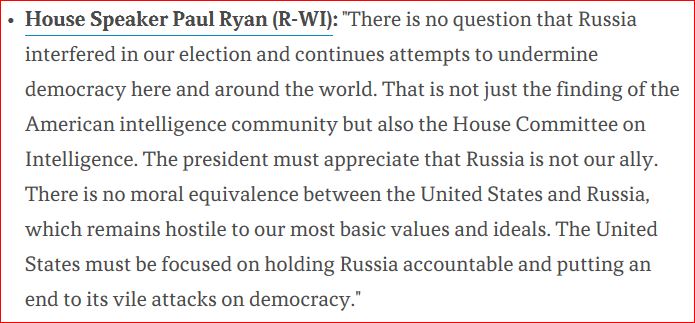
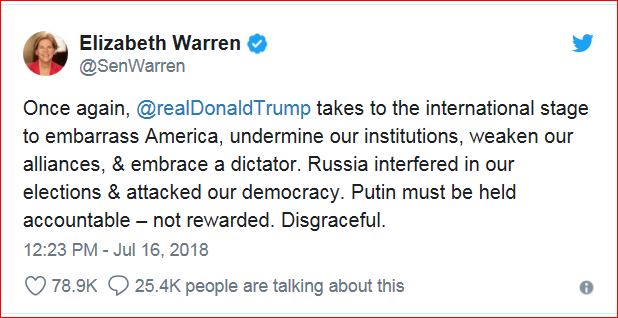
Robert Mueller’s investigation may eventually explain why, but we don’t need that answer now.  Actions speak and proof was on display Monday, July 16, at the Trump/Putin press conference in Helsinki.

The FBI, the Intelligence Community, and the Senate Intelligence Committee have all reported that Russia worked to help Mr. Trump in the 2016 election.  He was told this in January 2017.  He has consistently refused to accept this and did so again at the press conference.  He indicated that he put as much trust in the words of Vladimir Putin as he did in our own intelligence experts.

Mr. Putin wants Russia to again be an important player on the world stage.  He has limited ability to make his own country stronger, so his strategy is to make America weaker.  Mr. Trump executes this strategy every day.  Three examples:

We are a nation of immigrants.  America’s genius has been to absorb them and use their ideas and energies to enrich our economy and our society.  When he ignores our history, wars on newer immigrants, and divides our people, Mr. Trump makes America weaker.

Most children learn in the school yard that it’s better to have friends then enemies.  Mr. Trump has deliberately picked fights with old friends and allies like Canada, Germany, the UK, and others in NATO.  He is making America weaker.

There is broad agreement among those who study the subject that international trade has benefitted us.  Without warning, and without any evidence of consideration of its consequences, Mr. Trump recently launched a trade war.  Harley-Davidson and BMW have already announced plans to manufacture products in other countries that could be made here.  This trade war will hurt both workers and consumers and will make America weaker.

Because he is an agent of a hostile foreign power, we must restrict Mr. Trump’s influence as much and as soon as possible, and eventually remove him from office.  All those who support him are enablers of a Russian agent.

All those, who are enablers and also candidates for public office, should be defeated in November.

Bill Allen    07-21-18

Tom Friedman: America First or Trump First? op-ed

A Message From a C.E.O.: Tariffs Are Going to Hurt American Companies
op-ed

Posted in Politics | Tagged , | 1 Comment

CFD 2.1: Distribution of Carbon Fee Dividends

Main proposal below was completed on 07-11-18 and an introduction was added on 11-23-18. 

A formal CFD bill was introduced in the House of Representatives on 11-27-18.  It is HR-7173 and named the Energy Innovation and Carbon Dividend Act (EICDA) of 2018.  Full text of this bill is here.  The rule for allocation of dividends to children in the bill is changed from what CCL has advocated for many years, and that I call Version 1 in post below, to what I call Version 3.  Version 1 is no longer relevant.  (12-09-18)

HR 763 was introduced in the House in 01-21-19 and is very similar to HR 7173.  Full text of new bill is here.   Everything written below in 2018 is still applicable, if one ignores Version 1, and understands that Version 3 is the allocation rule that HR 763 contains today.  (06-26-20)

Bill Allen

Introduction

The system of carbon fee and dividend (CFD) proposed by the Citizens’ Climate Lobby (CCL) has a revenue side and a dividend side.  Comments below deal primarily with the determination and distribution of the carbon fee dividend.  They include a proposal to change the rule for allocating dividends to children from what is proposed by CCL today to one that will open a path to a much less complex and costly system for the determination and distribution of all dividends, and produce several other good outcomes.  I assume that the reader has some familiarity with CCL and CFD.

Background

I have advocated a carbon tax since the early 90s, promoted a system of carbon fee and dividend since 2010, joined CCL in 2013, helped start the Raritan Valley chapter for NJ District 7 in 2015, and have been active in it.

My introduction to what is now CCL’s rule for allocating carbon dividends to children was in James Hansen’s book Storms of My Grandchildren.  I read this in 2010 and concluded that it would be unfair and might create political problems.  As a member of CCL  I learned that it was proposing this rule, and that implementation would necessitate use of IRS data and a very complicated process for determining household structures.  I developed an alternative allocation rule that will simplify the process and resolve the fairness/political issue.  I proposed this rule to CCL leadership.  It was rejected.

In a presentation for Lobby Days in DC this past June, Allen H. Lerman presented a report in which he described CCL’s proposed system for distributing carbon fee dividends, some variations on that proposal, and another proposal from the Climate Leadership Council (CLC).  This report is entitled “Paying Dividends to American Residents from Carbon Fee Revenue” and is linked here as Lerman18.

I did not attend the presentation, but have studied the report.  I find much in it that is supportive of what I propose here.  And what I propose here will resolve some of the problems that Mr. Lerman identifies.

Mr. Lerman c0-authored with Danny Richter an FAQ report in 2016 that also informs my thinking.  Review it at LermanRichter16.

Goal, Strategy, Organization

[1] We need to define our goal.  Mine is to gradually reduce burning of fossil fuel in the US to zero in 40 years.  30 would be better.  We may never get to zero, but it should be our goal.

I believe CCL is committed to a long-term program, but not to the goal of zero.

[2] The best strategy for today and for the long term is a system of carbon fee and dividend (CFD) with a carbon fee schedule that rises aggressively.  We may also need other strategies.

If legislation for CFD is adopted with bipartisan support, and if CFD is introduced smoothly, it is likely to enjoy a honeymoon for a few years.  Then opposition will grow.

  • As prices rise and start to squeeze, people, who have not adapted because they were unwilling or unable to do so, will push to stop further fee rises or to abolish the program altogether.
  • Oil and gas companies, after their coal competition is gone, will oppose higher carbon fees.

We will need strong public support to continue the program.  This can come from two sources.

  • A steadily rising dividend stream will build a political constituency for CFD.
  • People will learn of, and experience more of the problems of climate change and demand strong action.

[3] Determination and distribution of carbon fee dividends will require a new agency, or a new department within an existing agency such as the Social Security Administration (SSA).  See Lerman18 on page 22 and  LermanRichter16 in Section 19.

Note:  A page number cited here is the number for the pdf file, not the one in the report.

I have made the case for a new agency and will assume here that it will be set up, probably inside the Treasury Dept.  I call it the Carbon Dividend Administration or CDA.  Names are important.  “Carbon” reminds us of the challenge, and “dividend” is more friendly than “fee” or “tax”.

CDA will become the public face of the CFD program.  Public support for CDA will translate to support for CFD, and dissatisfaction with CDA will reduce support for CFD.  It is essential that CDA be competent, efficient, and fair—and that the public sees it that way.  I doubt that these standards can be met with the system proposed by CCL today.  This concern helps drive the proposal below.

Dividend Share Allocation

[4] The current CCL proposal is to allocate one full dividend share to each adult, one half share to each of first two children in a family or household, and zero shares to later children.  A child is defined as a person 18 years old or younger.  I call this the Version 1 rule.

I propose that one full share be allocated to each adult, and that all children be treated equally, after accounting for age.  Specifically, allocate 1/19th of a share to a child for each year of his or her age thru age 18.  I call this the Version 2 rule and first proposed it to CCL in 2016.

The Climate Leadership Council (CLC) was formed in 2017.  It proposes to allocate one full share to each adult and one half share to each child.  I call this the Version 3 rule and include it in the dividend stream analysis in [11] below.

[5] Administration of the Version 2 rule will begin with transfer of data from SSA to CDA:  name, SS number, date of birth, residence address, and bank account if known.  There will be a large data dump at the start of the program.  After this there will be small and regular transfers of data for new registrants in SSA and for deaths reported to SSA.

With this data and a simple computer program it will be possible to calculate the dividend share allocation for every person in the CDA database for any future date.  Call this the “numerical” share allocation to distinguish it from the “monetary” dividend allocation that I describe below in [8].

Key points:  A person’s numerical share allocation will depend only on his or her birth date, and this will be in CDA’s database and never change.  Its calculation will require no access to or data from IRS.  This calculation will be low-cost and essentially error free.

Lerman18 on page 12 recommends that “self-supporting” persons under age 19 and not claimed as dependents be allocated a full dividend share.  When identified these persons can be tagged in the database for a full share.

I helped my wife raise two daughters and will state unequivocally that the costs of raising children rise as they grow from toddlers to teenagers.  The gradually growing dividend for a child with the Version 2 rule better aligns with family financial needs than does the static half dividend provided with Version 1.  More on this below in [11].

The path to CDA and dividends will be thru SSA.  A person not registered in SSA, and who is eligible for and wants carbon dividends, should register in SSA in the regular way.  Parents of a new baby should register their child in SSA as soon as possible.

[6] Administration of the Version 1 rule will be much more complicated.  It will require data on household structures that it will get from IRS.  It will have to update this every year, and there will always be some late or inaccurate filings.  Some household structures will change during a year.  The programming to construct household structures will be complicated.  Mr. Lerman addresses several of these issues, identifies potential problems, and suggests remedies in Lerman18.

I believe administration of the Version 1 rule will be expensive and produce errors and delays in dividend distribution.  I doubt that it will develop a reputation for competence, efficiency, and fairness—standards that I believe are essential and identified in [3] above.

Dividend Payout

[7] The schedule for carbon fees is very important.  The enabling CFD legislation should

  • start the fee schedule low,
  • raise it rapidly and high enough to achieve the goal,
  • adjust it annually for inflation,
  • make long term commitment to CFD, at least 20 years,
  • provide for periodic and in-depth review of economic and scientific outcomes, say every 4 or 6 years, and
  • provide for revision of schedule where appropriate.

Four schedule suggestions follow:

  • James Hansen in his 2009 book Storms of My Grandchildren recommends $11.50 per metric ton of CO2 in Year 1 followed by an increment of this amount each year.  This seemed reasonable to me and was the basis for my first analysis in 2010.
  • CCL now proposes $15 in Year 1 followed by an increment of $10 each year.  This also seems reasonable, except that I have never seen an explanation for $15 in Year 1.  To be consistent and to keep the starting fee low, I recommend that Year 1 be $10.
  • CLC proposes $40 in Year 1 followed by an increment of 2% each year.  $40 is much too high to start.  It would likely generate public backlash and could jeopardize CFD’s entire future.  The 2% rise in later years is too low.
  • Economist Alan Blinder in his 2018 book Advice and Dissent recommends $5 in Year 1 followed by an increment of this amount each year.  $5 seems too low.

[8] CDA will determine the total fee revenue to be paid out in a payout period.  It will add up all the numerical share allocations, and divide this share total into the payout total to get the “monetary” dividend value for a full share.  Then multiply this monetary share value by the numerical share allocation for each person to get the monetary value of the dividend for that person.

This will require a simple program that can be run quickly after the payout total is determined for a payout period.

Note:  CCL recommends monthly payouts, but there may be situations in which less frequent payouts are appropriate.  I use the term “payout period” to cover all situations.

[9] I see four ways to distribute carbon dividends.  CDA will send a letter with a Payout Form to every person in its database using regular mail to the address received from SSA, and will ask the person to choose one of four options:

  • Receive dividend as check sent via regular mail.
  • Have dividend deposited electronically in personal bank or debit card account.
  • Have dividend added to the dividend for another person, whom we will call a “bundler.”  This person will usually be a parent or guardian.  Call this the “bundling” option.
  • Have dividend deposited in a government account in the name of the person until the account balance reaches $XX.  Then send this amount to the person via regular mail or direct deposit.  The account will work like a savings account and earn interest.  Call this the “saving” option.

If direct deposit is chosen, the person will provide the account information.

With Version 1, a dividend will be determined for each household;  with Version2 it, it will be determined for each person.  Mr. Lerman estimates that this would double the dividend payments that would be distributed and states on page 81 of Lerman18 that “separate payment would increase the government’s disbursement costs by a small, but non-trival amount.”   The bundling third option will facilitate a single payment to a household that wants this feature, and should alleviate Mr. Lerman’s concern.

If bundling is chosen, the person will enter the name and SS number of the bundler on the Payout Form.  The bundler will sign the person’s form.  The bundler will indicate a payment option on his or her own Payout Form.

Some people may not have bank or debit card accounts and may not want to cash small checks.  The saving fourth option should work for them.  They will insert a value for $XX on the Payout Form.

The saving option will also serve persons who want an easy way to save the dividends.  They will select it and insert a large value for $XX.

The person will sign and return the Payout Form, and it will be his or her responsibility to keep address and account information uptodate.  If the person is a minor, the actions described here will be taken by his or her parent or guardian.

The Payout Form can also include tax withholding instructions.

Dividend Stream

[10] I served four terms on the governing body of my town, a suburban community in central NJ.  Property taxes were always a concern.  I learned that most people want continuity in taxes—not low this year and higher next year.  They authorize government to keep a reserve to buffer fluctuations in revenues and expenses.

I recommend that CDA manage dividend payouts to produce a steadily rising dividend stream—at least for the first 15-20 years before total carbon fee revenue starts to decline.  This will build support for CFD.  CDA will need a reserve.  Mr. Lerman proposes that fee revenue be deposited in a Carbon Fee Trust Fund.  This will be CDA’s reserve.

I show in [11] below that Version 2 will help produce a steadily rising dividend stream.  That’s one reason for introducing the dividend stream here.

Before the start of a new year CDA will determine the payout total for each payout period.  It will consider rising carbon fee schedule, projections of fossil fuel productions in coming year, current administrative costs, payback of one-time startup costs and loan for Year 1 dividends (described below), reserve balance at beginning and end of year, and  goal of steadily rising dividend stream.

Using the program described in [5] it will determine the dividend to be paid to each person in each payout period.  It will be good public relations for CDA to notify each person of the dividends he or she will receive in the coming year, as SSA does today.

CCL promises to return all carbon fee revenue to members of the public, except for a small administrative expense.  (Mr. Lerman estimates this to be 1.1% of revenue in Year 10.)  The proposal here is that the timings of the revenue and of the payout be decoupled, in order to produce a steadily rising income stream.  All revenue not paid out will be in the reserve, where it can be seen by a skeptic who doubts that we are keeping our promise.

For more re CCL’s position on “contemporaneous payments” and dividend estimation see Lerman18 on page 11.

There will always be a delay between the imposition of a fee on a quantity of fossil fuel at its source and the receipt of the actual fee revenue by CDA.  Say this is one year and that the revenue from fees imposed in Year 1 will be paid out in Year 2.  I recommend that CDA borrow from the general fund to pay dividends in Year 1, and pay back the loan over next few years.

This is a reason to set the Year 1 carbon fee low and keep the Year 1 loan small.

It will take time for rising prices of fossil fuels to ripple thru the economy and they may not show in some product prices for months or even years.  But not gasoline.  A fee charge of $10 per ton of CO2 at the well will probably produce an increase of about 9 cents per gallon at the pump very quickly—and very visibly.  Dividends should start arriving at the same time.  With borrowed Year 1 funds, CDA can make this happen.

[11] I made an analysis last year of the dividend streams for two families with both Version 1 and Version 2 rules for allocating dividends to children.

I have expanded the analysis to include the Version 3 rule.  (These rules were defined in [4] above.)  In comments below I will abbreviate Version 1 to V1, Version 2 to V2, and Version 3 to V3.

Note:  CCL in HR-7173 is now proposing Version 3.  See comment in preface to this post.

Below are links to six cases with different family structures.  Each is a spreadsheet with three analyses—one for each rule—and a chart that summarizes the results.

Description of spreadsheets:

  • Births are separated by 2 years for families with up to 4 children, and by 1 and 2 years for families with 5 and 6 children.
  • The birth year for the first child in a family is  Year 1 of the CFD program.
  • Each analysis is for the period from Year 1 to the first year that all children will have become adults.
  • The share value for a year in Col 2 is based on (a) a revenue model in which the carbon fee rises by $10 per year for 40 years, and CO2 emissions decline linearly from 5 billion tons in Year 0 to zero tons in Year 40, and on (b) an analysis of eligible dividend recipients made in 2010.
  • Col 3 thru Col 10 show dividend share quantities for members of the family using V1 rules for the year, Col 11 is the monetary value of all the dividend shares for the year, and Col 12 is the cumulative value thru that year.
  • There are comparable sets of ten columns for V2 and V3 rules.
  • The chart shows the dividend values for the years.

Click on a case below to see the spreadsheet for that household.  The lessons from the analyses make most sense if cases are reviewed from top to bottom.

Case 10  One adult, no children.

  • Chart shows trajectory of the value of a full dividend share:  first gradual growth, then flattening to peak in Year 19, and start of slow decline.

Case 12  Single parent, two children:

  • The chart shows only two lines, because V1 and V3 results are identical and the line for V3 covers that for V1.
  • The lines end up at the same place, but the line for V2 is smooth and that for V3/ V1  is crooked.  The inflection points for the V3/V1 line occur when a child becomes an adult and moves from a half to a full dividend share.
  • The V2 line is a little lower than V1 in the early years and higher in the later years.  I commented on this benefit above in [5].  The V2 dividend payouts are better aligned with the financial needs of the family over the childhood years than are V1 and V3.
  • Total dividends during the childhood years thru Year 20 are $48,841 for V1 and V3, and $52,332 for V2, a difference of 7.1%.

Case 22  Two parents, two children:

  • Same as Case 12, except that there is one more full dividend share allocated for the second parent every year.
  • Again total dividends for the childhood years for V2 are greater than for V3/V1.  $70,989 and $67,266, a 5.5% difference.  Reason:  V3/V1 children get a constant half dividend share every year.  V2 children get a larger fractional share as they grow older at the same time as the value of a full share is growing.  This difference exists in all cases.

Case 23  Two parents, three children:

  • V2 and V3 pay a dividend to a third child and V1 does not.  The childhood years are thru Year 22, and the cumulative dividends are $$88,322 for V1, $102,198 for V2, and  $97,643 for V3.  The V3 amount is 10.6% greater than V1, and V2 is 15.7% greater.  This shows the unfairness of the V1 rule.
  • The V2 dividend peaks in Year 21 and starts to decline, because the value of a full share peaks in Year 19.

Case 24  Two parents, four children:

  • The unfairness for a family with more children is more pronounced.  The childhood years extend thru 24.  The cumulative V3 amount is 18.2% greater than V1, and the V2 amount is 23.0% greater.
  • Comparison of the V2 and V3 lines shows greater impact of higher fractional shares for teenagers with V2.  This is an argument for V2.

Case 25  Two parents, five children:  Trends continue.

Case 26  Two parents, six children:  Trends continue.

Conclusions from analyses:

  • V1 allocates no dividends to third and later children.  V2 and V3 allocate dividends to all children, and resolve the fairness/political issue.  This is an argument for V2 and V3 over V1.
  • The smooth V2 line will help CDA produce a steadily rising dividend stream.  This is an argument for V2 over V3 and V1.
  • V2 pays out less than V3 and V1 in the toddler years and more in the teenage years.  This is an argument for V2 over V3 and V1.

“Simplification of the Carbon Fee Dividend Payment System”

[12] The section title above appears on page 46 of Lerman18.   The report lists five suggestions for simplification.  I paraphrase them below in italics and add some comments.

  • Provide dividend for all children:  This is a feature of both Version 2 and Version 3.
  • Increase child dividend from a half share to a full share:  A full share allocated to only the first two children would aggravate the fairness problem.  If allocated to all children it would invite the charge that CFD is encouraging irresponsible parents to have more children.
  • Keep dividend unchanged for whole calendar year:  Changing dividends during a year is not a problem for the Version 2 system described in [5] above.  The goal of a steadily rising dividend stream may require raising dividends during the year.
  • Have annual rather than monthly dividend eligibility determinations:  With Version 2 a person’s eligibility does not depend upon his or her relationship to anyone else.  Eligibility begins with transfer of data for the person from SSA to CDA.  Reasons for termination of eligibility will be rare (eg move to a foreign country).
  • Exclude carbon fee dividends from income taxation:  I have an opinion on this, but it is not relevant to the principle issue here of carbon dividend allocation.

The inclusion of this section in Mr. Lerman’s report suggests that he believes that the system should be simplified.  Version 2 will do that.

Startup

[13] We want CFD to begin right after the enabling legislation is fully approved.  But Mr. Lerner makes this sobering comment:  “Regardless of the distribution method selected, full implementation would not be immediate. In fact, under the direct payment method full implementation might take two years—or even longer.”  (Lerman18, page 14)  He is writing about Version 1.

I have no direct experience with internal federal government operations.  I did spend 43 years in large, private-sector, manufacturing organizations, the last 20 in operations planning.  I participated in the startup of new activities and the expansion of others.  Comment below is from that perspective.

After reading about the very complex Version 1 system in Lerman18 and LermanRichter16—with its many potential problems and remedies—and comparing it to the much less complex Version 2 described above, I conclude that two years to implement Version 1 would map to less than one year for Version 1.  This is a strong argument for Version 2 over Version 1.

Wrapup

[14] The simple change from the current CCL Version 1 allocation rule to the proposed Version 2 rule opens a path to a much less complex and costly system for the determination and distribution of dividends.  It will produce many advantages over what CCL proposes today.  A list follows:

  • Make system for determination and distribution of dividends fair for all adults and all children.
  • Increase dividends for growing families in accord with their financial needs.
  • Avoid political mine field of questions regarding “responsible” family size.
  • Reduce complexity and cost of system for determining and distributing dividends.
  • Remove need to access or use any IRS data.
  • Reduce risk of errors.
  • Reduce time to start up CFD.
  • Make it easy to set up new independent CDA.
  • Build trust in dividend distribution system.
  • Build long-term public support for CFD program.

Most important:  When CDA determines the total fee revenue that it will pay out in a payout period, it can immediately calculate the dividend for each eligible person in its database with a simple program that uses birth date data that is already in the database.  There will be no need to get other data from IRS or any other agency.

I strongly urge adoption of the Version 2 allocation rule.

Bill Allen    07-11-18

Posted in CCL-CFD | Tagged , , | Leave a comment

At stake is the society that we know

Letter below was submitted to the Bernardsville News on 06-11-18.  It was published in the on-line edition on 06-13-18 and in the print edition on 06-21-18.

I show two charts below the published letter and a comment. 

Bill Allen    06-21-18

==============================================================

EDITOR:

There has been a spirited exchange of views in these pages regarding the current occupant of the Oval Office.  A letter published on May 31 includes comments on global warming and related problems.  I will respond and focus here on the science—not the politics—of this existential issue.

The writer accepts the fact that earth has warmed in recent years.  He attributes this to “cycles of the sun” or “solar cycles.”  I think he is referring to sun spot cycles.  The number of spots that we see on the surface of the sun goes up and down over cycles of eleven years.

Earth receives more solar energy–what scientists call “insolation”–when there are more sun spots.  This phenomenon can move earth temperatures up and down by small amounts over the 11-year cycles.  But the warming that I worry about is over centuries.  There is no evidence that sun spot cycles influence the long warming trend that we observe today.

Milutin Milankovic described three astronomical cycles in the 1920s, and suggested that they caused the ice ages.  All numbers below are approximate.

  • Earth moves around the sun in an elliptical orbit that widens and narrows over a cycle of 100,000 years.
  • Earth rotates on an axis that is tilted with regard to the axis of its orbit, and this tilt moves back and forth by a small amount over a cycle of 41,000 years.
  • The axis of earth rotation wobbles like a top over a cycle of 26,000 years.

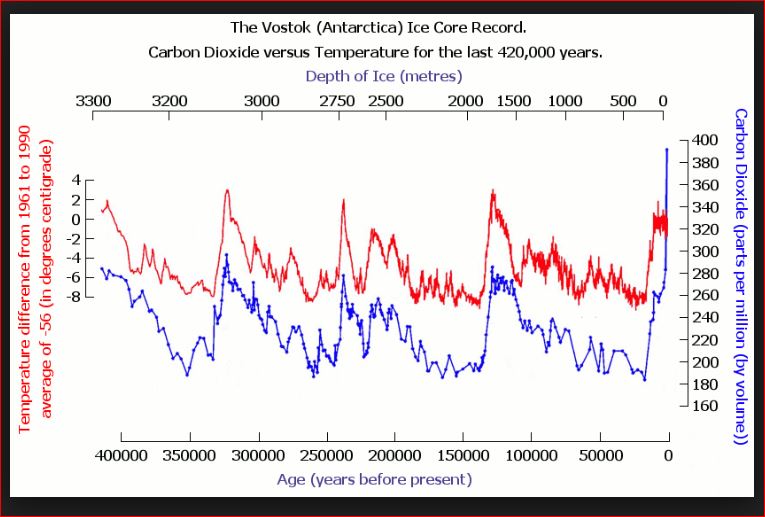
Charts of temperature show saw-tooth patterns for the last four ice age cycles.

  • The temperature cycles are 100,000 years long, like the orbital cycle. Let’s call these “long” cycles.
  • Temperatures decline to a minimum over 90,000 years and then rise relatively rapidly by 10 degrees Celsius over 10,000 years.
  • There are many smaller temperature ups and downs inside the long cycles.

The astronomical cycles change the amount of insolation that reaches the earth and its distribution over the earth’s surface, but not by enough to explain the rapid temperature rises in the long cycles.

Charts of atmospheric concentrations of carbon dioxide (CO2) show a strong correlation with the temperatures over the long cycles.  All this leads to the theory that follows:

  • During one part of the orbital cycle insolation increases, and this warms earth.
  • Warming causes the release of CO2 from oceans, soils, and vegetation.
  • ­This greenhouse gas rises into the atmosphere and causes more warming.
  • There is a positive feedback loop: increased insolation warms the earth, which releases more greenhouse gas, which warms the earth, which releases more greenhouse gas, …
  • Warming continues until later in the orbital cycle insolation decreases enough to stop warming and restart cooling.

Methane and other greenhouse gases influence temperature, but much less than CO2.

The letter writer states that CO2 levels have “drastically increased since the beginning of the industrial age,” that some of this has been absorbed by the ocean and caused an increase in acidity (lower pH), and that this “is a major global environmental concern …”  I agree.

He does not mention that most of the increased CO2 has gone into the atmosphere where it contributes to global warming via the greenhouse effect.

Here are some things that scare me.

  • Average CO2 concentrations during the last four long cycles swung between a low of 185 ppm (parts per million) and a high of 285 ppm. The rise during the warming phase was one part per million every 100 years.
  • The current CO2 concentration of 410 ppm is 40% higher than the previous highs, and it is rising 200 times faster. There is no sign of slowing.
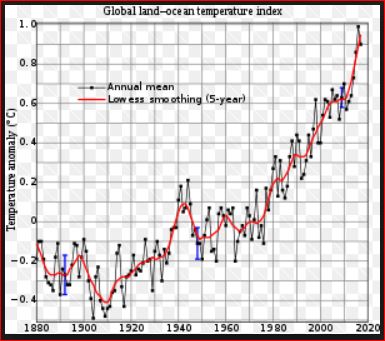
  • We are in a phase of the orbital cycle when temperature should be falling. But temperature is rising at a rate ten times the rate at the end of the last long cycle.
  • The natural cycle no longer controls. Man-made CO2 does.
  • There is increasing evidence that CO2 and methane are being released from Arctic permafrost that is thawing. No one knows how these releases will grow or how to stop them.

The world we will leave to our children will be harder and more dangerous than the one we received.  That’s certain.

Less certain is our will and ability to slow the warming process enough to allow future generations time to adjust to higher temperatures, and time to learn how to remove CO2 from the atmosphere and reverse the warming trend.

At stake is survival of the society we know.

Bill Allen    06-10-18

==============================================================

Two charts below were used to draft the letter above.  I hope to comment further on them in the future.


Quote below is from new book Weather:  an illustrated history:  from cloud atlases to climate change co-authored by Andrew Revkin.  He reported on the environment for many years for the NYT and then hosted an environmental blog for many more years.

“… our influence on the climate already guarantees tens of thousands of years of warmer conditions and rising sea levels (barring some geoengineering advance or an asteroid strike).”

Posted in Climate | Tagged , | Leave a comment

Thoughts on Earth Day and Global Warming

The letter below was submitted to the Bernardsville News on 04-23-18 and published in the print edition on 04-26-18.

EDITOR:

The first Earth Day was April 22, 1970.  No one worried then about global warming.  We should now. Warming and the associated threats of climate change, sea level rise, and ocean acidification are enormous.  But discussions on what to do, that should rest on science and economics, have become politicized.  Some thoughts follow.

(1) First the proposal:  Launch a program to ReEnergize America with a transition period of 30 to 40 years, during which we will slow and ultimately stop burning fossil fuels and the associated emission of carbon dioxide, the most important greenhouse gas;  learn to use less energy;  and switch to non-fossil energy like wind, solar, and nuclear.

(2) Use the free market to drive this transition with a system of Carbon Fee and Dividend (CFD), something I have proposed before.

Specifically:  Impose a gradually rising “carbon fee” on each fossil fuel at its source.  Start the fees low and raise them each year.  Return fee revenue to the private economy by dividing it into equal shares and distributing the shares to consumers as dividends:  one share to each adult and a fractional share to a child.

Rising fossil fuel prices will raise prices throughout the economy.  People will make billions of purchase decisions and move gradually towards products and services that cost less, because they depend less on fossil fuels.  The dividends will help them make the transition.

So will the business community.  It will see opportunities and act to provide products and services to facilitate the transition.  Examples for the home:  more efficient appliances, better insulation, smart controls for managing room temperatures, low interest loans to purchase these things financed by dividend streams, professional guidance, and many things we haven’t yet dreamed of.

Those, who believe that the economy works best when private persons make the buy and sell decisions, should like and support this system.

(3) Many surveys have shown that more Democrats than Republicans believe global warming to be an issue that we must address.  Gallop recently published data that confirm this.  Below are results for a question asked last year and again this year.

“Do you worry a great deal/fair amount about global warming?”

In 2017:  Republicans 36% yes, Democrats 90% yes, a gap of 54%.

In 2018:  Republicans 33% yes, Democrats 91% yes, a gap of 58%.

The data show a huge gap that appears to be growing.  It is probably impossible to mount a significant national response to global warming with this amount of disagreement.

(4) An over-whelming majority of climate scientists agree that the earth is warming and that we are seeing the effects today.  They point to evidence like record temperatures and storm events, rising sea levels, and decline of Arctic summer sea ice.  Yet 69% of Republicans in the 2018 survey think the threat is exaggerated, compared to only 4% of Democrats that do.

Related is the finding that 86% of Democrats know the scientific consensus, but only 42% of Republicans do.

Here we have disagreement over demonstrable facts.  Can we narrow the gap by calm presentation and discussion of facts?  Maybe, and we must try.

(5) Some may fear that the system of CFD will slow the economy.  We can reduce this risk to near zero.

Start the carbon fees low and raise them by set amounts each year in accordance with a predetermined schedule.  Review the economic and environmental outcomes periodically–say every four or six years—and adjust the fee schedule as needed.

Think long term.  Getting off fossil fuels may take 30 or 40 years.

(6) I believe that ReEnergize America will grow the economy.  The transition to conservation and non-fossil energy will generate new technologies and jobs.  I’m old enough to remember when the space program did this in the 60s and 70s.

America still has a healthy business environment—perhaps the world’s best–where innovators and entrepreneurs can flourish.

(7) Suppose people in future decades conclude that our scientists were wrong and that global warming was not really a threat.  No problem;  stopping burning fossil fuels will have been a winning “no regrets” policy.

They will have cleaner air and fewer breathing-related health problems.  We will have stopped mercury emissions from coal-fired power plants.  This element falls into water, works its way up the food chain, and puts human fetuses at risk for development disorders.

They won’t see in the news pictures of animals killed and habitats destroyed by oil spills.  Or of people killed and homes destroyed by exploding tank cars.

(8) The law requires auto insurance.  Most home-owners have insurance.  Many parents have life insurance–with face values many times their annual incomes–to provide for their families if they die.

Action to slow global warming is an insurance policy, where the beneficiaries are our children.  To those who deny the threat and won’t take out the insurance, I put this question:

What makes you so sure that you are right?

Bill Allen    04-23-18

Posted in CCL-CFD | Tagged , , , , | Leave a comment

Carbon Dividend Administration

The Citizens’ Climate Lobby advocates a system of Carbon Fee and Dividend (CFD), in which revenues from steadily rising “carbon fees” on fossil fuels are returned monthly or quarterly to the private sector via dividends to consumers.  Administration of CFD will require workers and managers in a new department inside an existing agency, or in a new agency.  The work will include determination of the carbon dividend share and amount that should be allocated to each eligible person in a payout period, and sending the amount to that person via a check or direct deposit in his or her bank account.

Consumers will be best served with smooth and continuously rising dividend streams, but fluctuations in the economy will produce fluctuations in the carbon fee revenue streams.  Management will need to plan ahead and create a reserve to balance them.  I recommend that all this CFD work be done in a new agency with the name Carbon Dividend Administration (CDA).

Before presenting arguments for a new CDA, I will address a common assumption:  that a separate agency will add to administrative cost.   Language in Section 19 of a report issued by CCL in 2016 negates this assumption:

“Even if hand led by the IRS or the SSA, a completely separate staff and completely separate accounting, record keeping, and computer systems would be necessary for the Dividend payments.”

To review this report go here.

Some suggest that the CFD work be done inside IRS.  An editorial in the New York Times on December 30, 2017 describes this agency as severely stressed, largely due to under funding and political attacks from Congress.  It is unable to do its job properly.  The many changes in the recent tax bill will make things worse.  Adding administration of CFD to this workload would be a very bad idea.

An independent CDA is a good idea for several reasons:

  • The CFD program will not add to the burden of the already stressed IRS.
  • CDA will begin with a clean slate, one not tarnished by the reputation of the IRS.
  • All CDA managers and employees will be able to focus their attention on the CFD program and build a reputation for fairness and competence.
  • Because it will be distributing money to ordinary citizens, not collecting it from them, and if it does its job well, CDA will become popular and unlikely be the target of political attacks.
  • CDA will be the public face for the CFD program.  Public support for CDA will translate into public support for CFD.  This support will be essential as carbon fees rise, and rising prices of products and services dependent upon fossil fuels begin to squeeze.
  • Names are important.  The word “dividend” is more appealing than “revenue” and “carbon” is a reminder of the great challenge we face.

Some suggest that CFD work be inside the Social Security Administration.  SSA is also underfunded and stressed, but not so severely as IRS.  The arguments for an independent CDA remain and are strong.

A new Carbon Dividend Administration will produce better outcomes then the alternatives and will not add to administrative costs.

Bill Allen,    12-31-17

Posted in CCL-CFD | Tagged , , | Leave a comment

Carbon Dividend Stream for Families with Children

This post originally used the names Version A and Version B.  They have been changed to Version 1 and Version 2 to be consistent with a post on the same issue last year.

The analyses described here assumed that emissions at the start of a CFD program would be 6.0 billion metric tons of CO2 per year.  This was too high and a more appropriate number would have been 5.0 billion.  All quantities would be lower by 1/6th, but the curve shapes and the conclusions would not change.  Bill Allen,  06-27-18 

Citizens’ Climate Lobby (CCL) proposes a system of Carbon Fee and Dividend (CFD), in which gradually rising fees are imposed on fossil fuels (aka “carbon fees”), and the fee revenue is distributed to the public in the form of “dividends.”

The current CCL proposal is to allocate one full dividend share to each eligible adult in a family or household, one half share to each of the first two children, and no dividend share to later children.  An adult is defined as a person 19 years old or more.  Call this Version 1.

I propose a full dividend share for adults, and also that all children be treated equally, after accounting for their ages.  Specifically, allocate 1/19th of a dividend share for each year of a child’s age, until he or she becomes an adult at age 19.  Call this Version 2.

One argument advanced for Version 1 allocation rules is that some families with young children will need more help in the early years.

Analyses:  There follow calculations for eight dividend streams:  for two family structures, for each of these in two time frames, and for each of the four, a dividend stream produced by Version 1 rules and another dividend stream produced by Version 2 rules.

Each analysis uses an estimate for the value of a dividend share in a year.  This share value is the total fee revenue to be paid out in a year divided by the total dividend shares that are to be paid out.  A series of these share values is in Dividend Share Value.  They are based on the following rules and assumptions.

  • The total US CO2 emissions from fossil fuels at the start of the CFD program are 6.0 billion metric tons (gigatons, GT).  This is based on reported emissions for 2015 and is rounded up.  Emissions will decline linearly to zero over 40 years.
  • A fee of $15 per metric ton of CO2 is imposed on a fossil fuel in the first year of the program and then raised by $10 in each year thereafter.
  • Carbon fees are not adjusted for inflation in this analysis.  They should be when the real CFD program is in operation.
  • The quantity of dividend shares in a year is based on a model I made in 2010.  I used population projections from the Census Bureau, an estimate of the population fraction that is children, and an estimate of the undocumented residents who will not be eligible for dividends.  The dividend shares estimate for Year 1 of the CFD program in the instant analysis is the dividend shares estimate made in 2010 for the year 2020.
  • Revenue generated by a specific fee level is paid out in dividends in the next year.
  • 98 cents of each revenue dollar are paid out as dividends, and 2 cents are used for program administration.
  • In each analysis the dividend stream begins in the year the first child gets his or her first dividend and ends when the last child becomes an adult at age 19.

Note that the value of a dividend share rises initially, gradually levels off, peaks in Years 18 and 19, and then turns back down towards zero.

The dividend stream analyses are in the cases defined below.  Click on a case to see the analyses and a chart.

Case A:  Two parents with two children separated by two years.  Dividends for the first child begin at age one in the first payout year of the CFD program.  Assume this is 2020.

Case B: Same as Case A, but with four children and age separations of two years.

Case C:  Same as Case A, but with time frame shifted out ten years.  Dividends for the first child begin at age one in the eleventh year of the CFD program.  This is 2030.

Case D:  Same as Case C, but with four children and age separations of two years.

Observations:

Case A:  Version 1 does allocate an average of $540 more dividends than Version 2 for Year 3 thru Year 7 for the 2-child family.  But they are less by an average of $1,012 for Year 14 thru Year 20.

I helped my wife raise two daughters, and I am certain that their carbon footprints grew over the years along with their expenses.  I believe most parents of two children would prefer the continuously growing dividend stream from Version 2 over that from Version 1.

Version 2 allocates  $4,190 (4%) more total dividends over the 21-year period.

Case B: Version 2 shows a huge advantage for the 4-child family after Year 8.  The dividends grow continuously thru Year 22.  And total dividends are $29,454 (21%) more over the 25-year period than those from Version 1.

Version 2 is clearly more fair and advantageous for a Case B family.

Case C:  This is the same as Case A, except that Year 1 for the family dividend is 2030.  Dividend share values start to turn down after Year 11 (2040), but the rising share allocations produced by Version 2 rules buck that trend to produce rising dividends thru Year 15.

Dividends from Version 1 are greater in the early years but start turning down in Year 10.  As a father who helped raise two children, I will state again that I would much prefer the smooth and rising dividend stream from Version 2, and I believe other parents would agree with me.

Case D:  The differences between Version 1 and Version 2 outcomes are more stark here.  Version 1 dividends start turning down in Year 10, and are very irregular in the late years.  Version 2 dividends rise smoothly thru Year 17 and then decline.

Total Version 2 dividends are $21,637 (16%) greater than Version 1.  Version 2 is again more fair and advantageous for a Case D family.

Wrapup:  I have several reasons for advocating Version 2 allocation rules:

  • make system fair for all adults and all children,
  • avoid political mine field of questions regarding “responsible” family size,
  • reduce the complexity and cost of the system for determining and distributing carbon fee dividends,
  • remove need to access or use any IRS data,
  • reduce the risk of errors,
  • make it easy to set up an independent Carbon Dividend Administration,
  • build trust in the dividend distribution system, and
  • build long-term public support for the CFD program.

I have explained these elsewhere.

My purpose here has been to examine the impacts of the two sets of allocation rules over the whole period that a family will have children under 19 years old.  I conclude that Version 2 will be much more fair and advantageous for both the parents and the children in these families.

These results prompt a prediction:  We will find no better way to grow support for CFD than to produce steadily rising dividends.  Version 2 does this better than Version 1 in each of the four cases examined above.

Bill Allen,    11-20-17 revised


Posted in CCL-CFD | Tagged , , | Leave a comment

Some decision makers are stepping up

The letter below was submitted to the Bernardsville News and published in the print edition on November 9, 2017.

EDITOR:

Hurricane Harvey dumped record rains on Houston. Myrtle had Category 5 hurricane winds for a record three days before it destroyed most of Porto Rico.  Wild fires in northern California killed 42 people and destroyed 8,000 structures.

No responsible climate scientist will say with certainty that all these events were caused by global warming, But no rational and responsible person will deny that the potential causes of these catastrophes, and the actions to reduce their occurrence, must be discussed seriously by our decision makers.

Fortunately, some decision makers are stepping up.

Following the 2016 election I wrote in this space that the mission of the Citizens’ Climate Lobby “has been to build support in Congress for government action to slow climate change. We have assumed that the White House would continue to lead, and that, with our help, bipartisan  majorities would form in both the Senate and House of Representatives to follow and adopt appropriate legislation.

“We must now revise our plan and persuade the Republican controlled Congress to lead. Will this be possible?  For the sake of my grandchildren and children everywhere, I pray that it will be.  Will this be difficult?  Yes.  Will this take more time?  Yes, and we have no time to waste.”

I then described several examples of Republican leadership on environmental matters at local and national levels.

This past May I reported progress. Members of the House of Representatives had formed the bipartisan Climate Solutions Caucus to “look for economically viable options to reduce climate risk.”  By design there were an equal number of Democrats and Republicans, at that time 36 total members.

I am very happy to report here that there are now 60 members in the caucus, 30 from each party. Congressman Leonard Lance, who represents us here in N.J. District 7, joined in June.

In May I also reported on the Republican Climate Resolution (H. Res. 195). By April it had been co-sponsored by 17 Republican House members.  Three of its nine findings follow:

“It is a conservative principle to protect, conserve, and be good stewards of our environment, responsibly plan for all market factors, and base our policy decisions in science and quantifiable facts on the ground.”

“If left unaddressed, the consequences of a changing climate have the potential to adversely impact all Americans…”

“There is increasing recognition that we can and must take meaningful and responsible action now to address this issue.”

There are now 22 Republican co-sponsors of the resolution. These include N.J. Congressmen Leonard Lance, Fank LoBiondo, and Chris Smith.

Thank you Congressman Lance and your Republican colleagues for stepping up to the most challenging issue of our times, and the one most important for our children and everyone’s children.

Bill Allen

Posted in Climate | Tagged , , | Leave a comment

Two are encouraging. One is scary.

Letter below was submitted to the Bernardsville News, posted on line on May 2, and published in the print edition on May 4.

EDITOR:

“The times they are a-changin’.”

So sang Bob Dylan in 1964. The words apply in 2017.

As I made my morning review of the news on April 7 a photo and headline caught my eye. I saw solar panels on the flat roof of a small building.  Nothing remarkable about that.  Then I read the headline:

“Harlan County, Ky., has a coal-mining museum. It’s putting solar panels on the roof.”

The reason for the solar installation is to save money on energy. The museum is in the southeast Kentucky town of Benham–the heart of coal country.

Bloomberg News reported on April 25 that Saudi Arabia is requesting bids for a 300 MW (megawatt) solar power plant. In January it had announced plans for a 400 MW wind power plant.  These are parts of a 30-50 billion dollar program to produce 10,000 MW of renewable energy by 2025.

Scientific American reported on April 21 that the Mauna Loa Observatory in Hawaii recorded its first-ever concentration of 410 ppm (parts per million) for carbon dioxide (CO2) in our atmosphere. CO2 is the most important greenhouse gas, and scientists believe that the earth has not seen a concentration this high in millions of years.  We produce CO2 every day when we burn fossil fuels–coal, oil, and natural gas.

The concentration was 316 ppm when scientist Charles David Keeling began these measurements in 1958, and the continuing series of measurements is called the Keeling Curve. It was 390 ppm in 2010 when I published here a letter to President Obama.  I urged him to launch “a program to ReEnergize America with the goal to stop burning fossil fuels by 2050.”

The first two news items above are encouraging. They show that people, from a coal county in Appalachia to the largest oil producing country in the Middle East, are moving to clean non-fossil energy.  But the third item is scary.  We are moving much too slowly.

The current administration in Washington is now moving aggressively to encourage more use of fossil fuels. This too is scary.  But there are small and growing positive movements led by Republicans in Congress

Members of the House of Representatives have formed the bipartisan Climate Solutions Caucus to “look for economically viable options to reduce climate risk.” By design there are an equal number of Democrats and Republicans, currently 36 total members, 18 from each party.

There is a Republican Climate Resolution (H. Res. 195). By April 25 it had been co-sponsored by 17 Republican House members, including Frank LoBiondo of NJ District 2.  Three of its nine findings follow:

“it is a conservative principle to protect, conserve, and be good stewards of our environment, responsibly plan for all market factors, and base our policy decisions in science and quantifiable facts on the ground”

“if left unaddressed, the consequences of a changing climate have the potential to adversely impact all Americans…”

“there is increasing recognition that we can and must take meaningful and responsible action now to address this issue”

It is time for those who represent your readers—Congressmen Leonard Lance and Rodney Frelinghuysen–to join and support these initiatives.

Bill Allen

Posted in Climate | Tagged , , | Leave a comment

That’s Why I Am Here

I recently joined the Basking Ridge chapter of Toastmaster International.  Its chapter name is Speech Meisters.  Below is a talk I gave yesterday.  It was called the Ice Breaker, because it was my first and its purpose was to introduce me to the members. 

I post it here because it deals with a subject discussed many times on this website:  climate change.  It also explains the quotation posted on the home page of this website.

Bill Allen,  05-04-17

Madame Toastmaster, fellow Toastmasters, and guests:

“The ultimate test of a moral society is the kind of world that it leaves for its children.”

These words are attributed to the German theologian Dietrich Bonhoeffer, and they define what I believe.

We may accomplish a lot in our lives. We may raise healthy, well-adjusted children, and give them a good education.  But, if we leave them a world worse than the one we received, we will have failed.

“The ultimate test of a moral society is the kind of world that it leaves for its children.”

I read these words ten years ago in a book by financier Peter G. Peterson. He was very concerned about the large and growing national debt, and what this would mean for our children.

This problem. and many similar problems, can be resolved easily if people of good faith set aside ideology, look at the facts, and apply common sense.

But the changes that we are making in our natural environment are different.

When we cut down tropical rain forests, they will not regrow in the lifetimes of our children or their children’s children, no matter how much common sense we apply.

When we make the earth warmer, and ice melts on mountain glaciers and Greenland and Antarctica, and that raises sea levels, we will not restore the ice and reduce sea levels again for thousands of years.

When we drive a species to extinction, it will never come back.

The most serious environmental problem, I believe, is climate change.

I’m a member of the Citizens’ Climate Lobby, a national organization with chapters in most Congressional districts.  Our mission is to persuade Congress to adopt legislation to slow climate change. We have two strategies:

First: Talk directly to our members of Congress.  For example, I am a member of the Raritan Valley chapter of Citizens’ Climate Lobby.  We have several times talked directly to our Congressman Leonard Lance and his staff.

Second: Communicate with our citizens and try to persuade them to support our program.  For example, we had a booth last year at the Charter Day street fair here in Basking Ridge, and talked to many people about climate change and our recommendation for action.

We also want to talk to local groups like Rotary clubs, Chambers of Commerce, garden clubs, and environmental commissions.

That’s why I am here. I have joined Speech Meisters to learn to speak effectively to these groups.

Now a little background.

My family has been in in Basking Ridge since 1968. My two daughters went thru the local school system.  My wife was active for many years in community organizations like the Girl Scouts.  I served two terms on the Township Committee in the 70s and two more in the 90s.

When planning for retirement I decided to spend the rest of my life working to protect the environment. As I have noted, I believe climate change is our most important environmental challenge.

But you will be relieved to hear that I won’t always talk here about climate change. I have in mind two stories I want to share about growing up in rural Hunterdon County.  I am thinking of a talk on the connection between the deer population and Lyme disease, and another on income and wealth inequality.

But–I will talk next about the potential for a 40-acre lake for fishing, swimming, and non-motorized boating– right here in Bernards Township.

Stay tuned!

Posted in Climate | Tagged , | Leave a comment

Global Horizontal Irradiance and Solar Power Generation

The morning headlines speak frequently of new solar powered plants for generating electricity and the declining unit costs for these.  My purpose here is to show that solar power generating performance depends upon the amount of energy received from the sun and how this varies across the US.  Some comments are particularly relevant for New Jersey.

Global Horizontal Irradiation

Scientists define the term “global horizontal irradiation” (GHI) as the “total amount of shortwave radiation received from above by a surface horizontal to the ground.”  It may be  measured in units of kilowatt-hours per square meter (KWH/M2).

Solar energy is most intense when the sun is directly overhead at noon in summer, and it falls off as the sun retreats to the west in the afternoon, and to the south in winter.  The position on the globe is also a factor, with more intense energy at the equator and less as one moves north or south.

Bottom line:  GHI is affected by the time of day, by the season of the year, and by the location on the earth’s surface.  It is also affected by material in the atmosphere that blocks some of the sun’s energy from reaching the surface, and this can vary daily with clouds and over longer periods with volcanic eruptions.

GHI Map

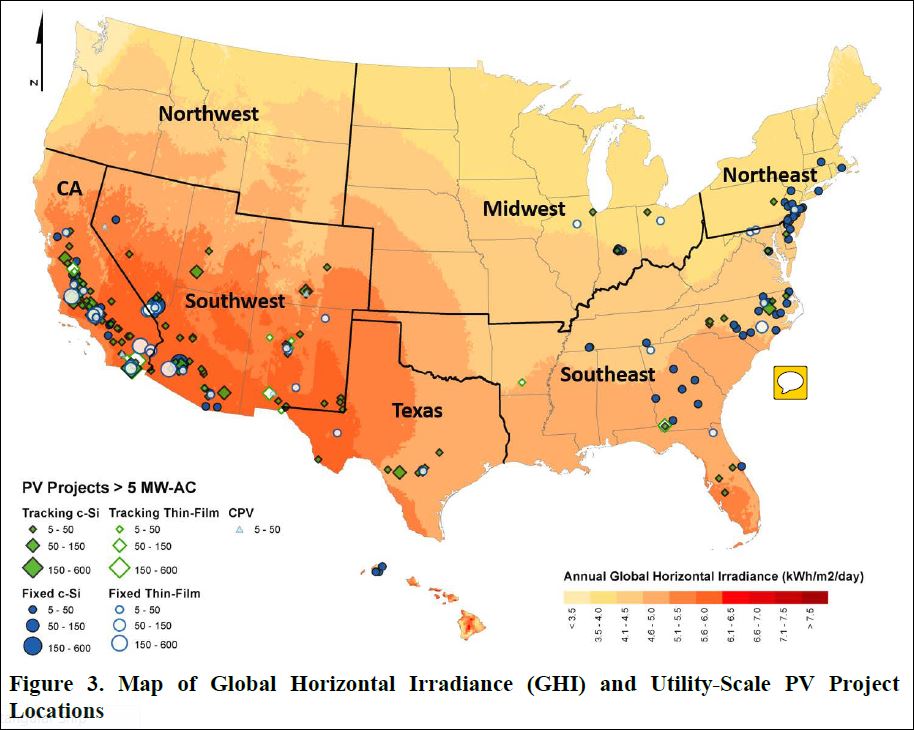
Scientists have measured GHI over time and throughout the world, and have made maps that show total average daily GHI by location.  A map for the US is below.  (See Note 1)

The map shows six GHI zones, ranging from the coolest in northwest Washington state (Zone 1, light yellow) to the hottest near the southwest border (Zone 6, dark orange).  Each zone is defined by a range of GHI values that are shown in the legend.  Note that these are averages for a 24-hour day and over a 365-day year.

NJ lies half in Zone 2 and half in Zone 3, for an average GHI of about 4.0 KWH/M2 per day for the state.  The southwest border is in Zone 6 with a median GHI of 5.8, 45% greater than NJ.

Electric Power Generation

The federal Energy Information Administration (EIA) publishes reams of data.  Useful for this analysis are a table of electric energy produced  and another table with so-called “nameplate” generating capacity, both organized by state, energy source, and year.

Data and a chart for solar energy by state in 2015 and GHI are in a spreadsheet.  To see this click spreadsheet.  Descriptions follow for the data in the columns.

Col A:  Codename for a state.

Col B:  The total power generated by all solar plants in a state in 2015.  This is the actual energy output and is measured in megawatt hours (MWH).

Col C:  Solar nameplate capacity for a state.  Nameplate capacity is the power that a plant is designed to produce when everything is working right.  This is the theoretical power output and is measured in MW.  A quantity in this column is the total of all nameplate capacities for the state.

Col D:  An estimate of GHI for a state from the GHI map.

Col E:  The theoretical energy output for a state is the theoretical power in Col C times 24 hours per day and 365 days per year.  The ratio of the actual energy output in Col B to the theoretical energy output is the “generation factor” or GEN FAC.  It is posted in Col E, and is a measure of overall plant performance.

Many things affect GEN FAC.  All production machines and facilities have to be shut down for routine maintenance from time to time.  Most have breakdowns and emergency shutdowns, though these may be rare.  Gas fired power plants may be scheduled to run just at peak demand periods or as backup, and this reduces their GEN FAC.  Solar plants don’t run at night, and wind turbines don’t turn when there is no wind.

Nuclear had the highest GEN FAC (0.88) of any energy source in the country in 2015.  Other values were coal (0.51), natural gas (0.30), wind (0.30), and solar (0.21).

GEN FAC for Solar Generation

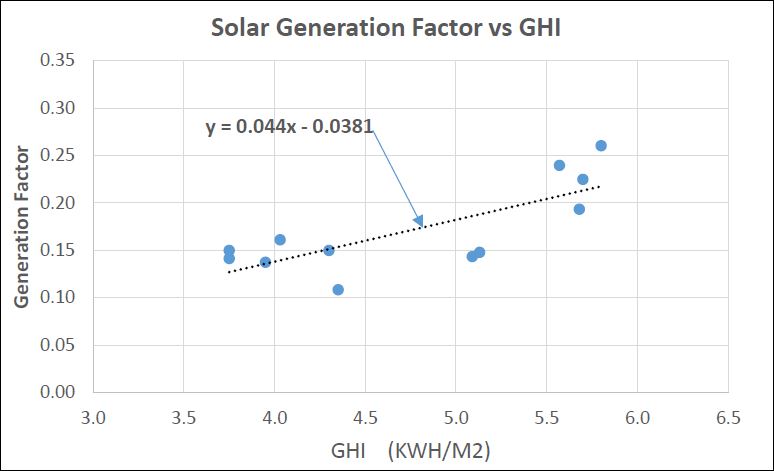
Solar energy is the focus here.  The chart below shows the generation factor as a function of GHI for twelve states that generated 100,000 or more MWH in 2015.  This chart and the associated data are in the spreadsheet.

This chart is a scatter plot with a well-defined trend line.  It shows that GEN FAC increases by 0.044 (4.4 percentage points) for each unit rise in GHI, where GHI is measured in KWH/M2.

This has implications for the costs of solar generated electricity.  When using the same technology, its cost in NJ, where GHI is 0.16 (fourth dot in chart from the left), may be 50% greater than that in CA, where GHI is 0.24 (fourth dot from the right).  Higher costs for land and labor may drive the NJ cost differential higher.

Bill Allen    01-29-17

Note 1:  The GHI map is from a report from the Lawrence Berkeley National Laboratory by Bollinger and Seel and entitled “Utility-Scale Solar 2015.”

Posted in Energy | Tagged , | Leave a comment